Hot Inflation Data Fails to Move Bond Yields Higher
Something very disruptive occurred in the bond market this past week and the smartest minds in the fixed income markets are scurrying to explain the anomaly that played out in one of the most counter-intuitive moves seen in recent months.
After the 10-year Treasury note yield traded from 1.00% on Jan. 28 up to 1.75% on March 30, the yield has steadily declined to digest what can only be considered a “spike.” A recent 10-year Treasury note chart illustrates my point.
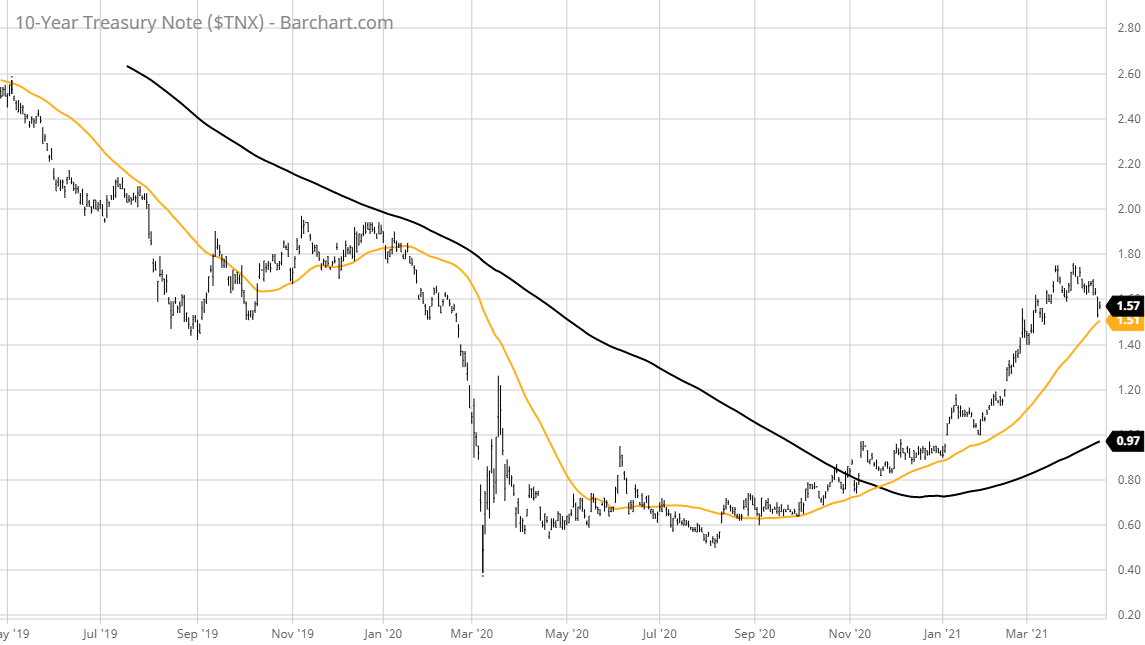
Some giveback on yield makes perfect technical sense, but considering the plethora of hot inflationary data that crossed the tape the past few days, seeing the 10-year yield take a sharp dip lower caught bond traders completely off guard. The economic calendar served up data that should have had the bond vigilantes foaming at the mouth.
The total Consumer Price Index (CPI) increased 0.6% month-over-month in March (consensus 0.5%) — the largest monthly rise since August 2012 — following a 0.4% climb in February. Core CPI increased 0.3% month-over-month (consensus 0.2%), following a 0.1% rise in February.
March retail sales soared 9.8% month-over-month, compared to a consensus estimate of 5.3%. Excluding autos, retail sales rose 8.4% month over month, topping the consensus estimate of 4.9%, following an upwardly revised 2.5% decline, compared to the previously reported -2.7% for February.
Housing starts surged 19.4% month over month in March to a seasonally adjusted annual rate of 1.739 million units, compared to a consensus 1.621 million, bolstered by a 15.3% increase in single-family starts.
Initial jobless claims for the week ending April 10 declined by 193,000 to 576,000 (better than the consensus of 695,000). The initial claims were the lowest they have been since the pandemic started and fell in a material manner that is consistent with the reopening and rehiring narrative fueling expectations of strong economic growth.
The Empire State Manufacturing Survey rose to 26.3 in April (consensus 23.0) from 17.4 in March. The Philadelphia Fed Survey increased to 50.2 in April (consensus 35.0) from a revised 44.5 (from 51.8) in March.
The preliminary reading for the University of Michigan Consumer Sentiment Index for April checked in at 86.5, up from the final reading of 84.9 for March. This is the highest reading in a year and was paced by a rising outlook on current conditions that were helped by job gains, rising vaccination rates, low interest rates and fiscal stimulus.
Once again, the yield on the 10-year Treasury Note, which ended March at 1.74%, went as low as 1.53% this past week in a surprising move that defied the various reports showing higher inflation rates and decidedly strong economic activity. There were various assumptions made as to why this counter-intuitive move in rates took place, ranging from short-covering activity to foreign buying interest to a sense that economic and earnings growth is nearing a point where it is as good as it is going to get for this cycle.
I think a better explanation of why the bond market staged its late week rally is how the $271 billion in new Treasury supply that was auctioned off went so well. The explosion of deficit spending has weighed on a couple of prior Treasury auctions and had become a bearish narrative. But the strong demand for U.S. debt drove down yields and the dollar, inciting risk-on capital flows into equities that sent the market to new highs.
The removal of yield risk to the investing landscape means the rally can sustain its extended and overbought condition for a while. The market has bought into the Fed’s rhetoric that any notion of tapering is not a consideration for some time, interest rates will remain historically low relative to inflation, early Q1 results are showing companies are beating increased earnings estimates and inflation-adjusted returns are more attractive in stocks relative to money market Treasuries.
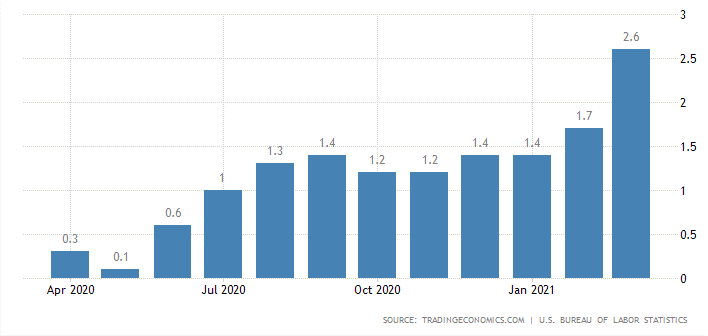
Watching how the rate of inflation comes in for April will be telling, after a hot uptick in March. Is the inflation increase transitory, as the Fed stated, or the start of a larger trend that will usher in some fresh concerns about economic overheating? The two charts below show the recent inflationary pop and the longer-term historical trend.
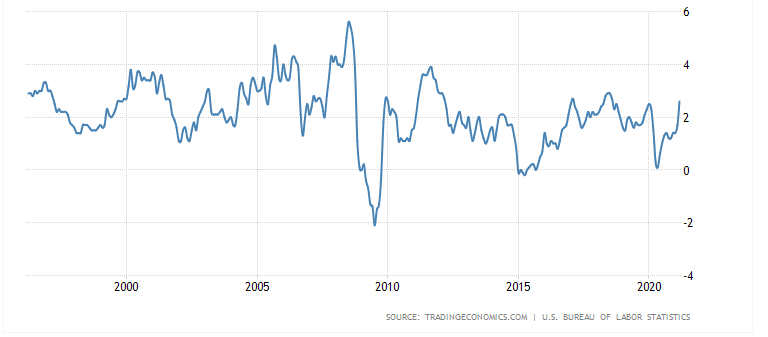
Leading up to the Great Recession of 2008-2009, the rate of inflation was in 2-4% range and ultimately got up into the high-5% range.
One thing for sure is that the stock market is “all in” on what the Fed is marketing in its fiscal policy. The Fed’s internal indicators are providing a very confident tone when Chairman Jerome Powell and the other Fed members speak out. But more importantly, the charts indicate that the stock market has a strong stomach for some inflation above the 2% target range, as long as the job gains continue, and incomes keep pace.
Investors should never lose sight that the United States is a consumer-driven economy where the cost-of-living drives sentiment. Plus, sentiment ultimately determines market trends.
So far, “transitory” is the buzzword of 2021 for stocks and the bull market. Until the Fed decides on another phrase, the path of least resistance for the S&P is higher.