Correction in Energy Provides High-Yield Buying Opportunity
By now, most investors have heard and come to understand how the yield curve for the bond market is inverted — where the two-year Treasury Note yields considerably more than the 10-year Treasury Bond.
An inverted yield curve historically marks a very difficult time for the economy in the coming months. Examples include major events like 13% inflation in 1979, the dot-com blowup of 2000, the housing crisis of 2008, the COVID-19 outbreak in 2020 and, in the current case, aggressive rate hikes to force a slowdown in demand after massive spending triggered rapid inflation.
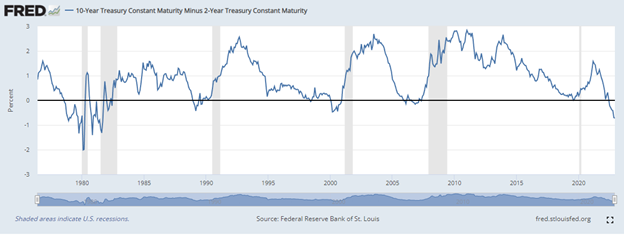
As of Dec. 1, the yield on the two-year T-Note stood at 4.27% while the yield on the 10-year T-Bond paid out 3.54%. The difference between the two yields is 0.73%, or 73 basis points, as illustrated by the graph below. This is the widest 2-10 spread since 1980, when the economy was in a deep recession. While there is one camp that argues such an inversion is a precursor to a hard-landing-type recession, others would contend that it marks a bottom for the economy followed by a gradual recovery.
What history tells us is that the economy does suffer a material slowing in the year following peak yield curve inversion, meaning 2023 will likely prove to be a challenging time for the U.S. economy that will include higher unemployment, lower housing prices, low gross domestic product (GDP) growth and lower earnings for the S&P 500. For the record, the past week’s rally has raised hopes that the economy will not fall into recession, but simply endure a slow growth environment.
Here is just one example of what’s happening in the housing market. The monthly payment on a 3%, 30-year fixed mortgage for a $400,000 home was $1,349 during December 2021. Today, the monthly payment on a 7%, 30-year fixed mortgage for a $400,000 home is $2,129 – a $780 increase. For a home buyer who wants to maintain that $1,349 monthly payment per their budget, she or he will have to settle on a home priced at $253,000. That’s 37% price differential. Either wages move higher or home prices decline further, or both occur.
History also shows that the year following a steep inverted yield curve, the stock market begins the next leg of the secular bull market. If past is prologue, 2023 should be a pretty good year for stocks. There are those who argue the bottom is in and the next bull leg has just begun. Some of this uncertainty will be sorted out by Dec. 14 at the Federal Open Market Committee (FOMC) meeting.
In another high profile and fluid situation, more volatility in the crude oil market can be expected. On Sunday, OPEC+ agreed to stay put on its production output targets as the energy markets contend with pricing in a slowing Chinese economy and a potential European Union boycott of most Russian oil imports and a price cap of $60 per barrel on Russian exports imposed by the European Union, the Group of Seven countries and Australia.
Some countries won’t sign on, and the policy directive is coming at a time when China and India are content to buy Russian oil at its current $66 per barrel price while WTI crude trades at around $81 per barrel. Russia has been effective at circumventing sanctions to date. If there were any teeth to this new set of sanctions and price caps, oil prices would likely be trading much higher. So, it stands to reason the status quo for an ongoing tight global energy market will persist.
The resurgence of COVID-19 in China has dampened sentiment for demand by oil traders amid a long-term timeline by which demand in China will increase when that economy full reopens. Overt pressure from the Biden administration on OPEC+ to increase supply had also weighed on oil prices heading into last Sunday’s meeting, but that obviously did not work out to the liking of the White House. WTI closed out the week around $80/bbl. and right where the Saudis want to maintain a floor.
Back in June of this year, the Royal Bank of Canada hosted an energy conference in New York with the highlight being a keynote speech by Mohammed Barkindo, the secretary general of OPEC. In his keynote speech, Barkindo warned that “OPEC is running out of capacity,” and that “with the exception of two or three members, all are maxed out.” Further, “the world needs to come to terms with this brutal fact” and that it is a “global challenge.”
I’ll take that statement at face value. OPEC+ is running out of spare capacity that supports the bull case for a strong pricing environment for crude oil and natural gas into 2023. Amidst all the confusion, most exploration and production energy stocks have pulled back off their recent highs and offer, in my view, some attractive entry points — especially in those stocks with variable dividend policies and those high-yielding domestic infrastructure investments.
Foregoing major capital expenditure (capex) spending in the face of an anti-fossil fuel administration, returning free cash flow to shareholders in the form of variable dividends has turned out to be one of the greatest inflation-fighting asset classes from both fundamental and total return basis in 2022. In the E&P space, Coterra Energy Inc. (CTRA) yields 9.2%, Devon Energy Corp. (DVN) yields 7.9% and Pioneer Natural Resources Co. (PXD) pays out a 10.4% dividend yield. (I have no position in these stocks.)
With oil prices having declined for much of the fourth quarter due to concerns over demand by China, the next round of variable dividends may not be as juicy as recent quarters, but listening to oil execs, their outlook remains bullish. Speaking to the most recent earnings release, Pioneer CEO Scott Sheffield noted, “I still think they will probably get back to $120, sometime mid-next year, once China opens up,” in a Bloomberg Television interview. Sheffield also said China’s growing energy infrastructure could surpass the United States if the country doesn’t invest more in areas such as pipelines and liquefied natural gas terminals.
A couple high-yield energy infrastructure exchange-traded funds (ETFs) and closed-end funds that convert the K-1 MLP income into 1099 ordinary taxable income include:
- Alerian MLP ETF (AMLP), paying 7.34%
- InfraCap MLP ETF (AMZA), paying 7.14%
- Kayne Anderson Energy Infrastructure Fund (KYN), paying 9.03%
(NOTE: I have no position in these funds.)
To ramp up domestic production, Sheffield added, Biden needs to speak not just with leaders of companies like his, but also with shareholders and financial players who fund the industry. Personally, I don’t see this dialogue being anywhere near constructive going forward. That reality will keep new development of energy sources limited and prices elevated. To this point, the risk/reward investment proposition continues to look very promising for energy companies dedicated to fossil fuels, as long as there is a major deficiency in supply by renewables.