Global Factory Uptick Benefits Leading Economies
When discussing the global economy, one of the many data points that gets eyebrow-raising notice from economists and investors alike is a country’s factory output. Whether it be a developed or emerging economy, this is a key indicator of core growth. When the biggest economies in the world are all experiencing a similar uptick in their manufacturing Purchasing Managers Index (PMI) reports, it’s a big deal.
The Purchasing Managers’ Index is an indicator of the economic health of the manufacturing sector. The PMI is based on five major indicators: new orders, inventory levels, production, supplier deliveries and the employment environment. The information to produce the PMI is gathered using monthly surveys sent to purchasing executives at approximately 300 companies. A PMI of more than 50 represents expansion of the manufacturing sector when compared to the previous month. A PMI reading under 50 represents a contraction, and a reading at 50 indicates no change.
Few would argue with the idea that the United States is currently leading the global economy out of recession, based on the fact that the Fed is the first central bank to tighten interest rates among the largest global economies. The Fed’s decisions are supported by steady improvement in many economic readings, not least of which are the monthly PMI reports. The Flash Markit Manufacturing PMI in the United States increased to 55.1 in January of 2017 from 54.3 in the previous month, beating market expectations of 54.5. That marks the highest reading since March of 2015, as higher work numbers boosted both output and purchasing activity.
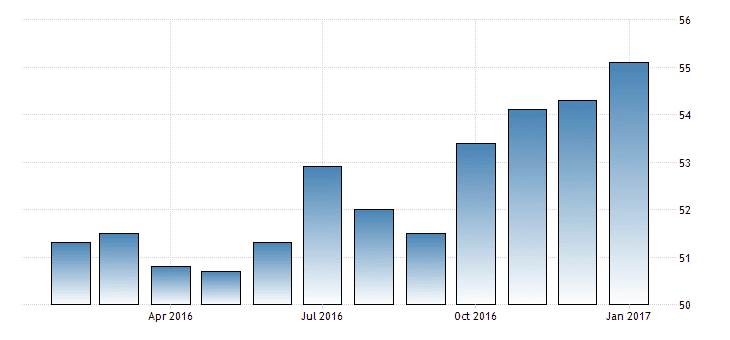
Source: Trading Economics — January 24, 2017
Looking outside and including the U.S. economy, for the past year, there has been an uneven pattern of fits and starts in factory output as it pertains to the United States, China, Japan, Germany and the other Euro zone economies. However, as early as 2016, all five economic powerhouses experienced similar and encouraging upticks in their respective PMI readings. In my view, that has bullish ramifications for global markets and central bank monetary policy going forward. I would venture to say that the Trump bump the markets have experienced since Nov. 8 took root back in July 2016, well before the election and not as a result of it. The Trump victory watered what was already a healthy garden of growth in the making.
Global bond markets have taken notice of this coordinated move off the economic doormat, evidenced by the unwinding of safety trades, rotation out of bonds and into equities, dramatic currency swings and rising forecasts about a pickup in inflation. Sovereign bond yields for each country have risen in tandem even as monetary easing remains in effect, with the exception of the United States. For the time being, the backup in government bond yields is being looked upon by the stock markets as more of a coincident indicator in the sense that it reflects more optimism about a long-awaited pickup in economic growth than it does serious concerns related to inflation being too much of a threat.
The largest global economies moving up and to the right of one accord might bring some much-needed redemption for central bankers, as it would provide some validation for policies that have long been criticized for lacking effectiveness. The trade-off, though, could eventually be a synchronized tightening effort if manufacturing activity continues to gather strength, economic growth rates increase and, of course, if inflation rates accelerate. But that scenario would be “a nice problem to have,” considering the alternative, which I’ll address if and when inflation does present a real threat to the bond market and all that is joined at the hip with higher interest rates.
The past week showed expectations for the five-year forward inflation rose by three basis points to 2.15% (fred.stlouisfed.org — January 27,2017), holding at a level that should certainly please policymakers at the Fed. Stability of oil prices plays a big role in this forward inflation figure. With WTI crude trading in a $50-$55/bbl. range, the combination of incrementally higher interest rates coinciding with rising gross domestic product (GDP) growth and modest inflationary pressure bodes well for the big picture of what is termed economic prosperity. A caveat is that the national debt and ongoing deficit spending need to be reined in at some point.
As of Jan. 29, the Gross Federal Debt was $19,939,908,790,870. At the end of FY 2016, the debt was $19.5 trillion, or 105.6% of GDP. The highest federal debt in U.S. history was 119.0% of GDP in 1946 just after World War II. At the end of FY 2016, the federal deficit was $587 billion, or 3.2% of GDP. The highest deficit in U.S. history is 29.0% of GDP in 1943, during World War II.
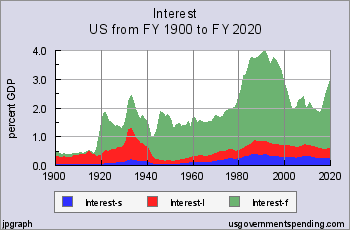
There is little argument that the real risk of government debt at this point is the burden of interest rates. Experts say that when interest payments reach about 12% of GDP, the government will likely default on its debt. The chart below shows the United States is a long way from that danger zone. Interest payments are expected to increase sharply in the near future as interest rates will normalize. Federal net interest costs for 2015 were 1.24% of GDP and are expected to climb to 2.4% by 2020, potentially giving President Trump and Congress some political rope to extend deficit spending on infrastructure, the military and job creation for the next four years while lowering tax rates on corporations in the hope of spurring GDP growth well above 3.0%. The goal would be to recoup the cost in future rising tax receipts from higher across-the-board revenue growth produced by small, medium and large businesses.
Only time and a lot of tweeting will tell if this formula plays out to the benefit of the greater good, but it sure beats the worn-out road of out-of-control entitlement spending, high taxation, strangulation by regulation and out-of-balance global trade deals that serve special interests.
For now, investors should breathe a sigh of relief and enjoy the place where the market is today compared to the literal gloom-and-doom headlines and bearish deflationary rhetoric that was crossing the tape this time last year when the S&P was knifed for 13% to the downside to 1,810 in the first month of 2016 trading. To see the S&P touch 2,300, or 27.07% higher off the low, while the Dow crosses 20,000 a year later is a testament to just how responsive the stock market is when it senses the domestic economy has turned the corner. And according to the PMI as well as many other indicators, it certainly has. Income investors who want exposure to the global uptick in factory output with rising yields should visit Cash Machine at www.bryanperryinvesting.com so as to not let the global recovery pass you by without producing your fair share of yield and gains.
In case you missed it, I encourage you to read my e-letter from last week about what how inflation may affect your investment portfolio.