Market Drives Ahead against Stiff Headwinds
Following last Friday night’s coordinated missile attack by a coalition of U.S., U.K. and French forces against Syrian chemical weapons facilities, there was a high level of consternation about whether the barrage of targeted airstrikes would escalate into a dangerous and wide-ranging military engagement between the Assad-led Syrian government backers (Russia, Iran, Hezbollah) and NATO forces.
While the attack did take out several military positions and research facilities linked to chemical weapons, it had little effect on degrading Assad’s power to wage further war on rebel factions. Russian President Vladimir Putin denounced the strikes as an “act of aggression” but made no mention of possible retaliation.
Russia’s defense ministry reported no casualties, either Syrian or Russian, or serious damage. So, a mutual stand down has resulted, since the United States, United Kingdom and France have indicated they’ve reached the limits of their military ambitions in Syria — for now at least.
As for investors, the global stock markets have averted another potential black-swan-sized crisis. There has been no shortage of disruptive forces that have fueled wild market swings for the past 10 weeks. It was smooth sailing through the end of February, and then a series of scenarios converged onto the investing landscape, creating large potholes of uncertainty that took a significant toll on short-term investor sentiment. The market was devoid of a single 2% move lower for all of 2017. Already for 2018, there have been seven such days, and a lot of nerves have been frayed as a result.
Fortunately, the underlying economic fundamentals have provided the necessary impetus for institutional fund managers to step in on each pullback and support the integrity of the primary uptrend. Following the steep drop on Feb. 9 that saw the S&P breach its 200-day moving average briefly, that key technical line in the sand that currently sits at 2,600 has been tested five more times during the past two weeks.
The last test on Friday, April 6, looks like it may prove to be where the market pivoted from last week’s rally, when buyers stepped in with conviction and short-sellers ran for cover. For all that has happened since late February, it is headline news that the market bent but didn’t break — and this is really the big story of the current week that investors can embrace. It is my view the market truly held its ground in the face of a swath of negative developments. If the economy were on shaky ground, the negative news would have triggered a much deeper correction and risk of recession.
Consider the Fed’s hike in interest rates on March 21, the passing of a massive $1.3 trillion spending bill on March 23 that dramatically widened the federal deficit, the resignation of former director of the National Economic Council Gary Cohn on March 6, the firing of former U.S. Secretary of State Rex Tillerson on March 13, the tariff tantrum between the U.S. and China on March 1 and Special Counsel Robert Mueller’s probe. Also factor in the raid of President Trump’s lawyer Michael Cohen’s office and hotel room by the FBI, as well as the missile attacks on Syrian chemicals weapons targets.
Now, America has a deadline to render unto Caesar (the IRS) what is Caesar’s (income taxes). I suggest that the potential move off this now-compressed level could make for an extended rally phase for the balance of April and well into May. First-quarter earnings season kicks off this week in earnest and I expect investors who stay long in good stocks amid volatility to be well rewarded.
While the path of the S&P 500 clearly exhibits the extreme volatility of the past two months, the weekly three-year chart of the S&P 500 below provides what I consider a much more constructive picture of how investors should view the current investing landscape. What looked like a very overbought market in late February gave way to a high-voltage pullback stemming from all the factors I’ve noted. Yet the long-term primary uptrend line that currently sits at 2,570, as of last Friday, continues to be a rising mark of technical support.
For investors seeking dividend growth, dancing a jig might be appropriate. According to data from S&P Dow Jones Indices, indicated net dividend increases for U.S. common stocks gained 56.9% over 2017, rising to $37.1 billion.
Overall, companies in the S&P 500 returned $419.8 billion to shareholders over 2017 through dividends, setting a record and rising from $397.2 billion in 2016.
“It was the eighth consecutive year of higher payments and the sixth consecutive year of record payments,” said Howard Silverblatt, senior index analyst at S&P Dow Jones Indices. He added that “conditions are favorable” for 2018 to be another record year. According to business information firm IHS Markit, global dividends are expected to rise 10% in 2018, to $1.65 trillion. That would represent the highest level of annual growth since 2014.
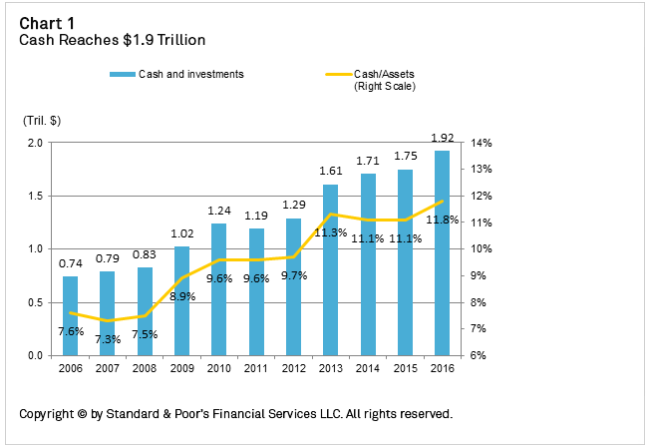
And it’s not hard to understand why. In the United States alone, just those companies in the S&P 500 have been hoarding more than $1.9 trillion in cash which began in response to jurisdictional tax disparities and global economic uncertainty following the Great Recession, then accelerated over the past decade as big U.S. corporations accumulated profits offshore in lieu of repatriating the funds and taking a tax hit.
There is a sea change now taking place. The global reflation trade is in full swing, the return of cash flow to shareholders is at a record pace and that is why, in my opinion, the U.S. equity markets are set to extend the current rally well into 2019. The benefits of tax reform are just being felt, U.S. companies are sitting on a record amount of cash and dividends are a popular use for that money, along with merger and acquisition activity and stock buybacks.
According to S&P Dow Jones Indices, companies in the S&P 500 repurchased about $129.2 billion of their own stock in the third quarter, the most recent period for which it has data. That level represents growth of 15.2% from the third quarter of 2016. Fourth-quarter 2017 data for buybacks isn’t published yet but will likely show a continuation of the same bullish trends. What is most encouraging, though, for the greater good, and should result in higher-quality job creation across most sectors of the economy, is the record level of business investment, the highest since 2011. In my high-yield advisory service, Cash Machine, I recommend a few select blue-chip covered-call closed-end funds that are paying between 6-11%. Those funds also are exhibiting less volatility than the market because of the juicy yields being paid. Those picks and more high-yield recommendations can be found by clicking here. Thousands of income investors have discovered a wealth of income-generating strategies that target an 8-10% yield in the Cash Machine model portfolio.
Earnings season is finally here and it’s beginning to look, smell and feel like spring is in the air on Wall Street. And how nice is that? And by the way, as nice as it is to make money, don’t forget to take time out to smell the flowers.