Rally Begs For Broader Sector Participation
The U.S. stock market has put up a strong performance off the March 23 bottom if one is long the Nasdaq, S&P 500 and the leading mega tech and health care stocks. The draft horses of these sectors are big weightings in the Invesco Nasdaq QQQ Trust (QQQ) and SPDR S&P 500 ETF (SPY) shares. We’re all keenly aware of just how much of the heavy lifting they demonstrated.
The obvious question that is yet to be answered is whether the cloud kings, the 800-pound-gorilla e-commerce retailers, fintech celebs, 5G giants, stay-at-home hotties and “cure COVID-19 now” stocks can continue to trade higher and carry the market’s water. It stands to reason that, at some point, the stock market needs to broaden out to where other sectors start to play catch up to sustain the rally, assuming the economy is going to recover.
After reading a very insightful article on Seeking Alpha this past weekend penned by Eric Parnell, CFA, titled “You Want The Stock Market To Go Down,” I wanted to highlight some very salient points in the article while overlaying my thoughts to express where we are in the market’s recovery cycle.
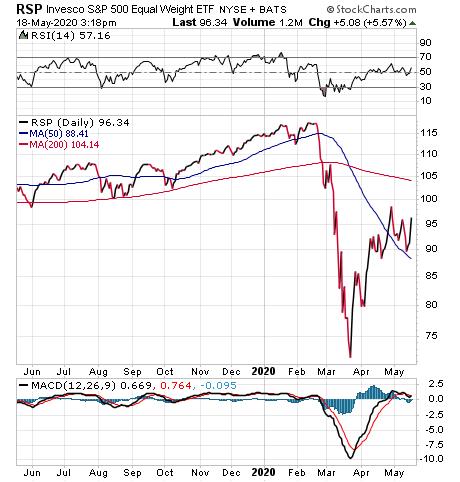
The chart below of the S&P 500 Equal Weight ETF (RSP) paints a different picture of the market and, in my view, more clearly reflects what the real economy is experiencing. Where shares of SPY were challenged to trade above their 200-day moving average (MA) last week, shares of RSP are trading well off their 200-day MA at $104.19.
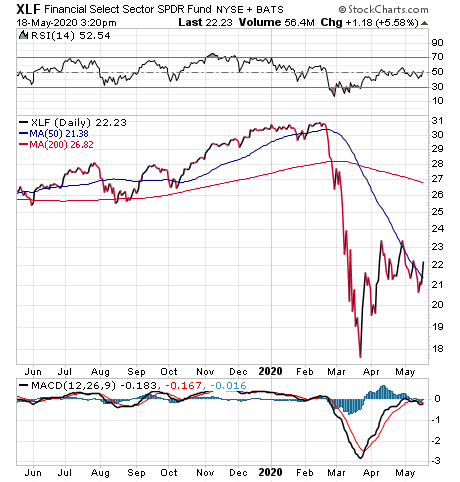
Here’s the rub. Despite the $7 trillion in stimulus fashioned by the Fed, Congress and the Treasury to shore up markets and investor confidence, there are some troubling signs underneath the market that emerged last week, namely the appearance that the financial sector is really struggling. For the rally to build on itself, it’s important that the financials participate to the upside.
A chart of the Financial Select Sector SPDR (XLF) shows the sector experienced a minor move up off the March 23 low and has failed to take out its downward-sloping 50-day MA. Some leading bank stocks are already taking out their March 23 lows.
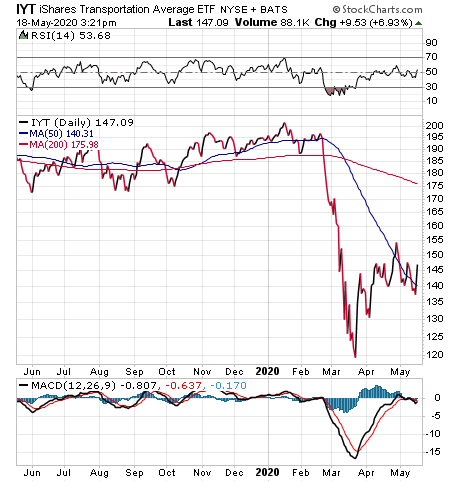
There’s also trouble brewing in the transportation sector. It is widely understood that the performance of the Dow Jones Transportation Average is regarded as a leading indicator for the broader U.S. stock market. And most would argue that the six airline stocks within the 20-stock index are the ball and chain for the sector at present.
What if we instead look at the iShares Transportation Average ETF (IYT), where the top 10 holdings that make up 71.79% of total assets do not include any airline stocks or Boeing Co. (BA), but are made up of the leading railroad, trucking, air freight and logistics stocks? Stripping out these losers should provide a better tell for the economy.
After what was looking like a genuine rebound building on itself in late April, shares of IYT have shed 11.6% and are trading back below its sharply downward-sloping 50-day MA that implies a retest of the March lows is arguably in the cards.
Similar chart patterns exist for the S&P 500 Industrial Sector SPDR (XLI), the S&P 500 Real Estate Sector SPDR (XLRE), S&P 500 Energy Sector SPDR (XLE) and even the S&P 500 Utilities Sector SPDR (XLU).
Now, let’s look under the hood a bit more at internal market volatility. The VIX of VIX (or VVIX) is a measure of the volatility of the Chicago Board Options Exchange (CBOE) Volatility Index (VIX). The CBOE’s VIX measures the short-term volatility of the S&P 500 indexes, and the VVIX measures the volatility of the price of the VIX. The VIX is trading back below the 40.0 “real fear” level, closing last Friday at 31.89. So, what’s the problem?
The VVIX is a leading indicator for the VIX. It peaked on March 19 before the VIX peaked on March 23. The VVIX started moving sharply higher as of early last week, probably reflecting the selling pressure in the financials. This sudden reversal in the VVIX is a yellow flag and could be signaling that the risk of selling pressure will return in the weeks ahead.
Friday’s passage in House of Representatives of the Nancy-Pelosi-sponsored $3 trillion HEROES Act gave the market another temporary sugar high and stemmed the selling pressure of prior sessions. A watered-down $2 trillion version will likely get passed by the Senate and signed by President Trump, and the market is being buoyed by this latest fiscal development. At least that’s how I see it.
Going forward, the reopening of the American economy will determine whether the yellow flags being raised turn into red flags or green flags. Testing for COVID-19 and antibodies is about to be offered on a widespread basis, and the number of known coronavirus cases will probably rise as a result.
The most important data point that I believe that will influence the stock market is fresh and updated data on hospital admissions due to the virus. If this number plateaus and tapers off as states reopen for business, the market will very likely ride out whatever negative economic and earnings news is thrown at it and avoid retests of the lows. Let’s hope the reopening of America goes not just well, but better than expected, because this shut-in life we’ve all been living amounts to a big fat zero.