Small-Cap Index Reaches a Key Inflection Point
This past week saw a number of potential market headwinds emerge that pressured the major averages lower.
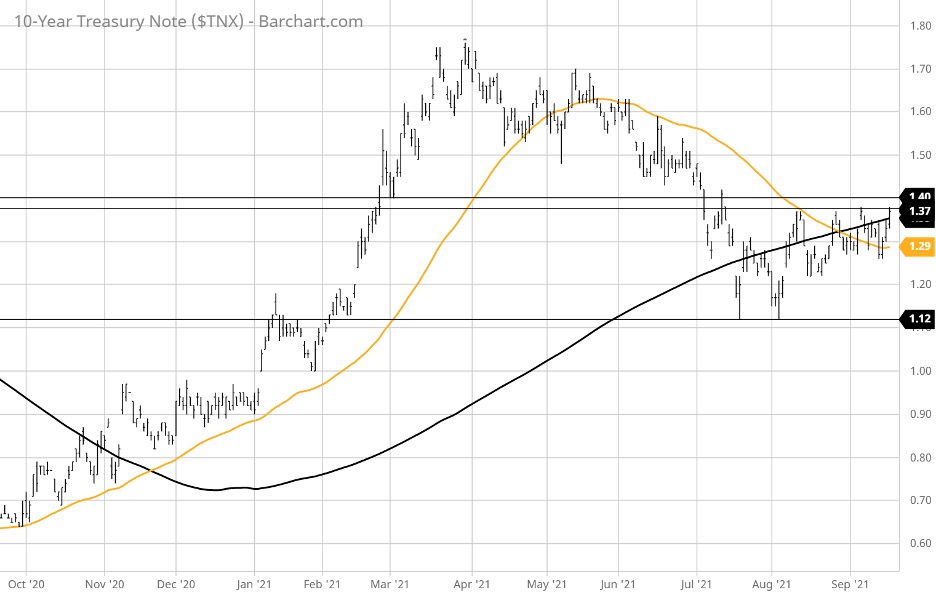
Mixed data showing higher inflation at the wholesale level, tame inflation at the consumer level, surprisingly strong retail sales, upbeat manufacturing in the New York region and subdued consumer confidence, pushed Treasury yields marginally higher on a net basis. The yield on the 10-year Treasury note is at a key inflection point, where a move above 1.40% will likely trigger further technical selling.
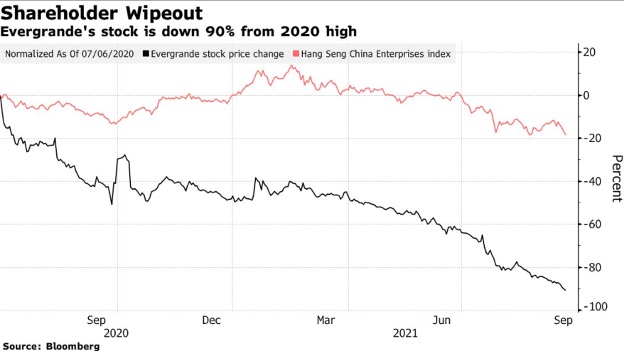
Several articles are circulating from the Wall Street Journal, Forbes, Barron’s and about every other news outlet regarding the potential collapse of Chinese mega-developer Evergrande and whether this will be a “Lehman moment” that has a systemic impact on global markets if Beijing allows for what could be a default of over $300 billion in debt payments.
Evergrande’s business accounts for about 2% of China’s gross domestic product (GDP), and the stock of the company has lost roughly 90% of its value. Hence, at this point, it seems the worst-case scenario of a controlled crash, bankruptcy and breakup of the company by the state looks likely to be absorbed by Western rather than Chinese markets. Evergrande committed two great sins of using way too much leverage and financing a great deal of its development through the shadow banking industry. Yet, the company is probably too big to fail, requiring the intervention of Beijing as soon as this week.
And then there is the Fed meeting this week to determine whether fiscal policy should include a scheduled scaling back of quantitative easing (QE) at a time when the full impact of inflation, the Delta variant of COVID-19 and the various supply chain disruptions are not yet known on business conditions for the current quarter. To this point, the market is trading as if the Fed will continue to jawbone the idea of tapering, but not act on it.
Lastly, Congress has to raise the debt ceiling to avert a default on U.S. federal debt… again. This hot debate and political brinkmanship will occupy Capitol Hill for the next two weeks, putting further delays on the passage of a much-needed infrastructure package. Toss in the recent spike in WTI crude prices to $72/bbl. and one would think the market’s best-case scenario is a sideways finish to the year.
Under this set of circumstances, it would seem that the least path of resistance for equities is lower, but markets are forward-looking and have likely priced in most of the pessimism brought about by these noted risks. Assuming there is progress on all these fronts in the next month, it might behoove investors to take a hard look at going long in the Russell 2000 and small-cap stocks, where the majority are domestic companies. This might be the most under-owned sector with the most room to run.
What’s good about this investment setup is that the downside risk is very well-defined by looking at the year-to-date chart of the Russell 2000 iShares ETF (IWM), which has been consolidating in a 20-point range for the past eight months. Logic would have it that if the risks outlined above were going to truly undo the primary bull trend, shares of IWM would have already broken down through key support at $216, where its 200-day moving average (MA) sits. Instead, we see a chart pattern where both the 20- and 50-day MAs are converging with the 200-day MA and trying to turn higher.
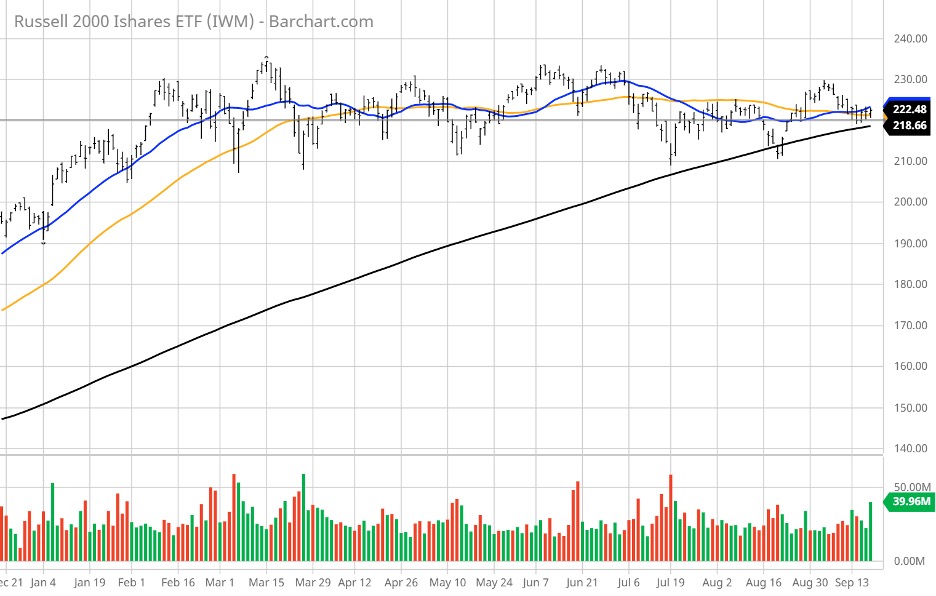
A break of the $218 level and further violation of the $210 level would be where an appropriate mental or physical stop-loss would be appropriate. This implies downside risk of 1-3.5% and upside of, let’s say, 20-30%. The technical maxim of “the longer the base, the higher the space” comes to mind here. Eight months is by definition, a long technical base, and a huge opportunity for profits if this key support level holds.
The Russell 2000 has missed out on this year’s rally. As of last Friday, Sept. 17, the Dow is up 13.00%, the S&P jumped 18.02% and the Nasdaq raced ahead by 16.73%. Considering that the small to mid-cap stocks hold the greatest amount of investment risk, to see this tier of the market looking to push higher in the midst of so much hand wringing is not only counterintuitive, it is starting to look very compelling.
One thing market technicians will tell us about the IWM chart is that there is intense technical pressure at this inflection point to where the next move, be it up or down, will be powerful. This setup is one of the great and most interesting things about the stock market: it will behave in ways that defy logic only to be understood well after a big move has occurred. There are circumstances beneath the surface of the market’s veneer that are offsetting a weaker NYSE advance/decline line and other negative factors.
What these factors are at present is elusive as far as I can tell, but if shares of IWM trade above $235 on heavy volume, it will be off to the races for the Russell and provide broad confirmation that the bull market has further to go. It is September, and pessimism is elevated due to the unknowns surrounding Fed policy, tax policy, the debt ceiling, rising bond yields, stalemated infrastructure spending, the Delta variant, a meltdown in Evergrande, slowing growth in China, rising oil prices and global supply bottlenecks.
And yet, the Russell 2000 has not rolled over. It actually looks like it is staging for an upside breakout, which would be a most welcome event as it would indicate capital flows are increasing risk-on exposure to the U.S. economy. How this scenario will unfold is still a coin toss, but the one thing the IWM chart fully suggests is that we’ll know one way or the other in the near future.