Teflon Bull Market Shakes Off Headline Risk
This past week saw the market undergo its first real test of how it would manage headline risk.
A Bloomberg report that China may trim or halt its purchases of U.S. (China Weighs Slowing or Halting Purchases of U.S. Treasuries — January 10, 2018) Treasuries prompted selling in the Treasury market, sending the yield on the benchmark 10-year Treasury note to its highest level since March 2017. The higher yields pushed equity investors to take some profits in a knee-jerk reaction.
An already weak dollar traded to new two-year lows (see Dollar Index DXY chart below) on the China-related headline, despite robust economic growth. So, some international investors are reluctant to buy more Treasury securities. The 10-year Treasury bond yield has risen from 2.41% at the end of 2017 to an intraday high of almost 2.6% last week. As the yield curve gets steeper, this will give the Fed potential room to raise key interest rates further, but the slide in the dollar raises some new concerns.
There is no evidence that Treasury bond yields are rising due to inflationary pressures yet, so there is no need to panic that interest rates will continue to steadily climb. However, logic would have it that robust domestic economic growth, rising Treasury yields and a reduction in the size of the Fed’s balance sheet would be bullish for the dollar, as has been the pattern of similar situations in the past.
Seeing the dollar break key technical support at 94.0 raises a yellow flag. Even Rick Santelli is mystified as to why the dollar is breaking down and this is right in his wheel house. When Rick is confused, we should all take notice and keep a close eye on this potential fly in bullish ointment.

Rick Santelli of CNBC. Source: ConservativeQ.com
Equities eventually reached their flat lines but slid back into the red following a Reuters report that Canada believes that U.S. President Donald Trump will soon pull the United States out of the North American Free Trade Agreement (NAFTA) (source: Reuters: Canada Increasingly Convinced US Will Pull Out of NAFTA — January 10, 2018). General Motors, which traded flat ahead of the report, finished lower by 2.4% due to its heavy exposure to Mexico’s auto market. Again, without verifiable commentary from the White House or State Department, rumors create an unknown quantity of risk and fear. But for this market, fear is only temporary.
So, the China bond strike, potential NAFTA pullout and crumbling dollar to contend with, the Dow, the S&P 500 and the Nasdaq hit their worst marks shortly after last Wednesday’s opening bell, holding losses between 0.5% and 0.7%. It looked for a moment that emotional selling would heat up and feed on itself. The notion that China would stop buying U.S. debt sent shivers through the bond market and all manner of speculation hit global trading desks. After all, they are the biggest buyers and thus matter greatly.
But this Teflon bull market wasn’t to be denied. Investors took full advantage of the early selling pressure and stepped in as a CNBC interview with legendary investor Warren Buffett stated that he remains a net buyer of stocks, citing low interest rates and the recently passed tax reform legislation. Interestingly, the three stories about China, NAFTA and the dollar had nothing in common with Buffett’s comments regarding favorable interest rates and lower corporate taxes, but emotions were calmed and the “buy the dip” mentality that has characterized this bull market for the past 10 years prevailed once again.
Remarkably, the Dow recovered from an early triple-digit loss last Wednesday, Jan. 10, and ended up just short of unchanged. The financial sector, the second heaviest group by weight, led all sectors for last week in anticipation of last Friday’s earnings releases from some leading investment houses such as J.P. Morgan, Wells Fargo, PNC Financial and BlackRock, all of which surpassed Wall Street estimates fueling a second day of a 200-plus-point gain for the Dow, which along with the S&P, Nasdaq and Russell 2000 soared to new record highs to close the week out.
Market Melt up or Prosperity Break out?
The phrase “market melt up” is now showing up everywhere and has gotten more press than it deserves. It is important to articulate just what comprises a market melt up. By definition, it is a dramatic and unexpected improvement in the investment performance of an asset class or broader market, driven partly by a stampede of investors who don’t want to miss out on its rise rather than by fundamental improvements in the economy. Gains created by a melt up are considered an unreliable indication of the direction the market is ultimately headed, and melt ups often precede melt downs.
Based on all the recent economic data and early bird fourth-quarter earnings reports from several blue-chip companies, the notion of a melt up simply doesn’t hold water. For Q4 2017 (with 5% of the companies in the S&P 500 reporting actual results for the quarter), 69% of S&P 500 companies have reported positive earnings per share (EPS) surprises and 85% have reported positive sales surprises. Earnings Growth: For Q4 2017, the blended earnings growth rate for the S&P 500 is 10 2%. All 11 sectors are reporting or are expected to report earnings growth for the quarter, led by the Energy sector.
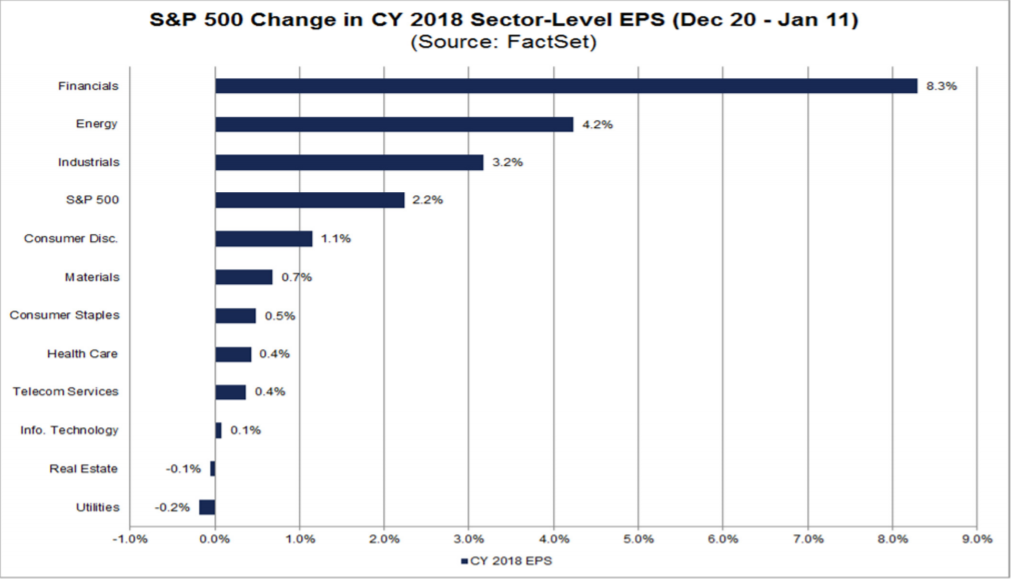
During the fourth quarter, many S&P 500 companies made positive comments about the potential benefits of tax reform. On Dec. 20, Congress passed the tax reform legislation, and President Trump signed the bill into law a few days later. Since this date (and ahead of the fourth-quarter earnings season), analysts increased their earnings expectations for the S&P 500. The 2018 bottom-up EPS estimate (which is an aggregation of the median 2018 EPS estimates for all the companies in the index and can be used as a proxy for earnings) increased by 2.2% (to $150.12 from $146.83) from Dec. 20 through Jan. 11.
This represents the largest increase in the annual EPS estimate for the index over this time frame (Dec. 20 through Jan. 11) since FactSet began tracking this data in 1996. At the sector level, nine of the 11 sectors have recorded an increase in their bottom-up EPS estimates for 2018 during this window, led by the Financials sector (+8.3%) (source: FactSet Earnings Insight — January 12, 2018).
Prosperity is defined as a successful, flourishing, or thriving condition, especially in financial respects. Until the numbers suggest otherwise, it should be no wonder the market is repricing itself higher. Damn the naysayers, full speed ahead!
In case you missed it, I encourage you to read my column from last week about the validity of the “January Effect” on markets.