A Closer Look at the Earning Reports
Just as the earnings season was getting into a bullish rhythm with the majority of companies reporting third-quarter results coming in above estimates, some recent events sent fireworks throughout trading desks around the globe that once again proved we are in a very schizophrenic investing landscape.
For most of last week, momentum was building on the notion that a post-election rally was in the making as long as the outlier risks were of the garden variety. The past week was packed with earnings releases and the economic calendar also featured a few noteworthy reports.
But all things considered, the S&P 500 respected a fairly narrow range. The index surrendered ground every day of the week to log its longest losing streak in eight years. It may be the S&P 500’s longest losing streak since the worst days of the financial crisis, but the damage remains relatively contained.
During the 2008 losing streak, the index dropped a cumulative 23% as the financial system teetered on collapse. This time around, the S&P 500 is down just 3% during the current slide.
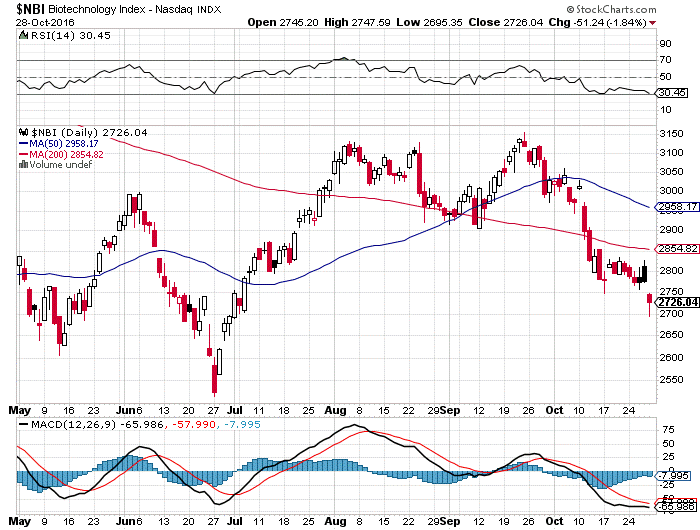
A short-term bump in the tech road is easily digested. The underperformance in the Nasdaq was mostly due to relative weakness in biotechnology. Some of the weakness in biotechnology (see Biotechnology Index — NBI chart below) was exacerbated by a poor quarterly showing from drug distributors. In addition, soft forward guidance reminded us that the pharmaceutical industry continues wrestling with pricing concerns that may become a regulatory issue once again, especially if Hillary Clinton wins the presidency.
Adding to the headline risk, Hillary Clinton’s chances were called into question after it was reported that the FBI is once again looking at the presidential candidate after new pertinent information came to the forefront. The news introduced uncertainty ahead of the upcoming election, knocking the stock market from its early September high. Interestingly, biotech names climbed off of their lows after the news began making the rounds. However, the FBI director’s update to Congress on Nov. 6 reported the latest batch of emails the agency reviewed did not turn up any criminal activity on the part of Hillary Clinton, who received a boost in the polls. A market rally today followed that news.
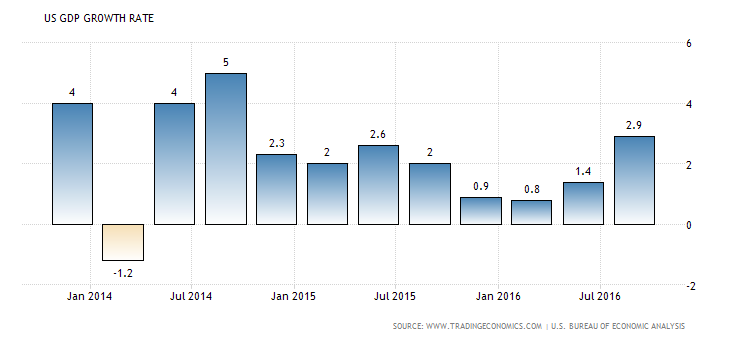
And then there’s the upcoming Federal Open Market Committee (FOMC) meeting scheduled for Dec. 14. Rate hike expectations for December firmed up after New Home Sales and Pending Home Sales for September beat expectations. Third-quarter advance gross domestic product (GDP) also surprised to the upside (2.9% versus consensus 2.5%). The growth rate was the fastest recorded in two years after expanding an anemic 1.4% in the second quarter.
Since the recession ended in mid-2009, the economy has grown at roughly a 2% annual rate, making the current expansion the weakest on record back to 1949. Exports, which add to GDP, increased at a 10% rate in the third quarter, the best gain in nearly three years. Export gains had slumped over the prior year and a half, in part, because a stronger dollar made U.S. goods more expensive overseas. But separate data suggested that shipments of agricultural products, especially soybeans, supported the latest gain. (source: Wall Street Journal, U.S. Economy Roars Back, Grew 2.9% in Third Quarter)
This latest data point on GDP definitely moved the needle on forward Fed monetary policy. Acceleration in growth in the third quarter, as well as continued improvement in the labor market and indications of higher inflation, will lead the Fed to boost the federal funds. The implied probability of a December hike increased to 74.2% from the prior week’s 69.9%, as indicated by the fed funds futures market.
Checking Under the Hood of the GDP Report
It is a widely accepted view from economists that consumer spending accounts for about two-thirds of total output. As noted, third-quarter acceleration in GDP largely reflected increased exports and a buildup of inventories, while consumer spending increased at a slower rate. The third-quarter GDP report showed consumer-spending gains slowed after a strong advance this spring. Personal-consumption expenditures rose at a 2.1% pace in the third quarter compared with a 4.3% gain during the prior period. The latest data “do not point towards a new growth path but rather a strong rebound following one year of soggy growth,” said Joseph Brusuelas, chief economist at consulting firm RSM US.
A quick glance at the one-year chart of the U.S. Retail Index would suggest that investors should be wary of headline numbers that aren’t supported by the data tied to consumer spending. From a purely technical point of view, the following chart shows a sharp breakdown.
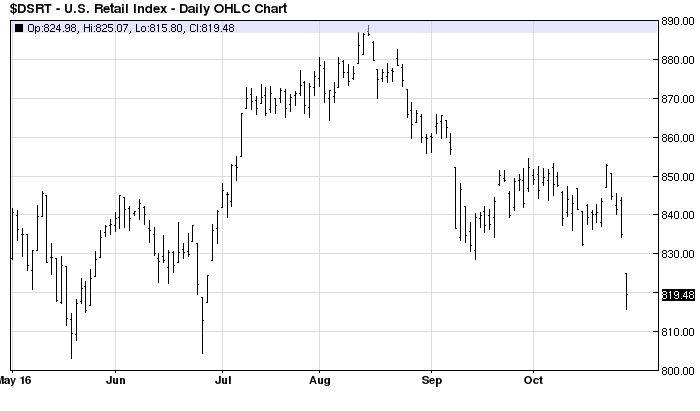
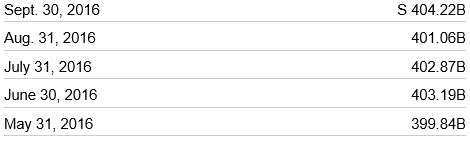
U.S. Retail Sales Historical Data, according to the table below, shows a gradual advance of sales in real month-to-month dollar terms. Yet the graph above clearly shows the prices of retail stocks coming under severe near-term selling pressure.
On the surface, this is a disturbing set of circumstances in that if stock prices are understood to be a forward-discounting mechanism, then it would stand to reason that the consumer is going to curtail spending just as the economy is looking to reach escape velocity from the umbilical cord of easy monetary policy and sluggish growth. Stocks of many leading homebuilders, building supplies, footwear, clothing and restaurants traded sharply lower in the past month, setting a cautious tone and raising a yellow flag right in front of the holiday shopping season. My view is a good dose of election-related nervousness has some negative influence on investor perception about slower future spending. Once we’re past Nov. 8, American consumers will loosen their purse strings heading into Black Friday and beyond.
Apparently, I’m not alone in this assumption. Yields on Treasury Notes and Bonds rose this past week to their highest levels in five months, the benchmark 10-year T-Note closing out last week with a current yield of 1.845%, per the chart above. Bond investors aren’t concerned about an apparent pause in consumer spending or we would see the yield heading decidedly lower. There might be some wait-and-see posturing on small ticket item purchases, but sales of RVs, boats and travel as reported by several companies in these sectors during the third quarter were nothing short of robust. One could sum it up that there is a pattern of more selective shopping for higher quality goods and one-time purchases, while spending on experiential destination travel and entertainment is high on the bucket list for a more discerning U.S. consumer.
In case you missed it, I encourage you to read my e-letter column from last week about how to spot the bull investments in a falling market.