Key Levels to Consider in an Overbought Market
Investors would be hard-pressed to find an experienced market technical analyst that doesn’t think the major averages are “pegged” at current levels, hovering in extremely overbought territory and due for at least a short period of consolidation. It’s a quandary, in that there is the FOMO (fear of missing out) crowd that missed out on the 10% run up in the S&P 500, the growing belief that the Fed’s next move will be to cut in the Fed Funds rate and the history of year-end seasonality that supports a bullish upside move.
The one-year chart of the S&P 500 shows the index roaring 400 points, from 4100 to 4500, in just three weeks, now sitting 150 points above its 50-day moving average (blue line) with the 200-day moving average (red line) just underneath, both of which are turning higher. Connecting the tops of the previous rally attempts, it is clear that when the SPY broke above 4400 in dramatic fashion, it was game on for the bulls.
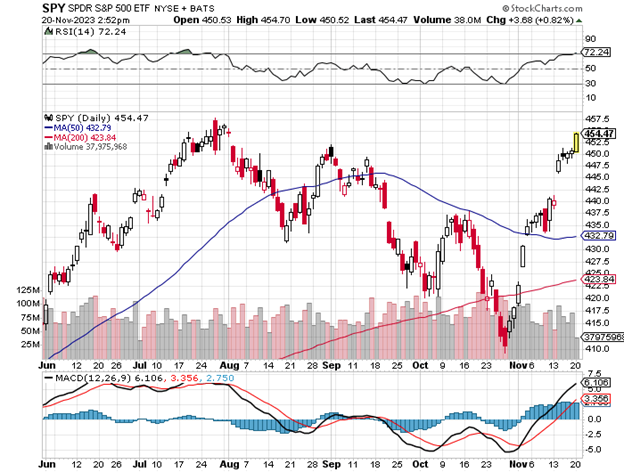
The torrid rally created some gaps underneath that market technicians would contend need to be filled to bring structure to what looks to be a new primary uptrend following three months of fairly intense consolidation. A pullback to 4400 is a reasonable assumption that qualifies as “the pause that refreshes,” with a full 50% retracement to 4350 also a possibility, but much less likely given the fresh appetite to get long equities.
It’s interesting that while the Dow, S&P and Nasdaq are all trading squarely above their respective 200-day moving averages, Wall Street and the financial media are jumping for joy about the move in the Russell 2000, which, in my view, was the mother of all short-squeezes with questionable fundamentals to support the move. The largest subsector in the Russell 2000 is financials (23%), followed by Health Technology (11%) and Technology Services (10%) as the third-highest weighting.
Shares of the Russell 2000 iShares ETF (IWM) show the index putting in a massive reversal, again on overwhelming short-covering, and trading up to its 200-day moving average (red line), where it slammed into overhead technical resistance and backed off. For this index to truly breakout to the upside, it will require a broad recovery of the small- to medium-sized banks, and that’s a tall order. For this rally to be confirmed as more than just another Magnificent Seven upside breakout, it will require broad market participation, some of which is genuinely taking place in other sectors.
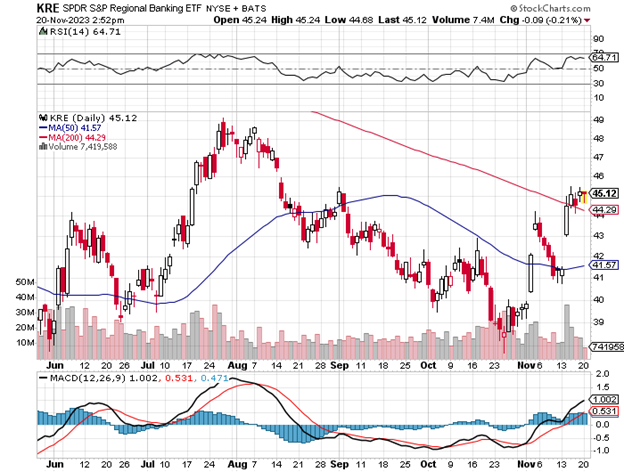
It stands to reason that a sustainable rally will involve some much-needed repair in the banking sector. Drilling down a bit more to understand the internal overhang in the broad market, one need not look further than the regional banks. Shares of the S&P Regional Banking SPDR ETF (KRE) show this subsector trading right back up to its downward sloping 200-day moving average following nearly nine months of consolidation from the spring meltdown.
There is a legitimate concern about the ongoing risk-leverage ownership of sub-2% Treasuries on the books, and that of commercial real estate exposure and the ability to refinance semi-vacant properties with dramatically reduced valuations in a considerably higher environment for commercial mortgages. The math simply doesn’t work. According to Bloomberg, “The value of distressed U.S. commercial real estate neared $80 billion in the third quarter, its highest level in a decade, as rising interest rates and sagging office demand shook the property market.”
But this $80 billion figure pales in comparison to what’s on the horizon. “Those depressed prices make it harder for the industry to refinance the $2.2 trillion of U.S. and European commercial property loans due to mature by the end of 2025.” For now, it seems this whale-sized problem is of no concern to market participants. Neither is the latest negative outlook by Moody’s regarding the now $34 trillion in federal debt, or the war in Gaza or the potential of more stress from future Treasury auctions.
Nope. At present, market sentiment is galvanized on the rally in bonds and the perceived surety of a Fed pivot, with over $5 trillion sitting on the sidelines as potential powder for further market gains. Whether the market does, in fact, provide the desired pullback of say, 5%, it will probably be a function of further data that shows the consumer tightening spending into the all-important holiday-shopping season.
The latest read on the consumer from the University of Michigan survey showed a fourth straight month of declines for sentiment. This might change for the better with gas prices retreating, and numbers from Black Friday will be out later this week to add some color. Most of the weakness in the sentiment reflects lower income and millennial spenders that are now having to service student loans again. Those with stock and bond portfolios seem to still be spending freely on discretionary goods and services.
Will investors get their shot at buying the market at a lower level? That’s a hard call. It is rare when a big gap underneath the S&P 500 isn’t filled at some point. “When” and “if” could be soon or could come in early January as has been the case in some years. Just keep an eye on the Russell 2000, the Regional Bank Index, retail sales figures and the upcoming Treasury auctions. Most of the 11 market sectors are seeing marked improvement in their respective charts but, again, everything bounced hard on the notion that inflation and interest rates have peaked and are heading lower.
A period of digestion over the next couple of weeks would be very constructive to resolve the current overbought market conditions while affording underinvested investors a chance to leg into equities on a meaningful dip. Whether Mr. Market provides that Christmas gift is another thing. Wall Street’s version of Santa has been known to be stingy in years past.