Market on Guarded Watch For SVB 2.0
Opinions about how the first quarter earnings season is going to play out are very mixed. There are those that believe the market’s resiliency is about to get a major wake-up call where profits and guidance will sorely disappoint, and there are just as many that believe the companies are going to deliver top- and bottom-line results that surprise to the upside despite some recent softer data on retail sales and manufacturing.
The Q1 earnings parade officially kicked off last Friday, and it was a very good start to the reporting season. The money center banks led by JPMorgan Chase & Co. (JPM) did not disappoint, enjoying huge deposit inflows from the regional banks. “The empire strikes back,” said Jason Goldberg, a senior research analyst at Barclays. As depositors and other market participants responded to regional bank uncertainty in recent weeks, he added, “There’s been a flight to bigness.”
Although the big banks posted record revenues, they issued a cautious tone about the recent stress in the financial sector and the negative impact it could have on future lending. Considering the guarded outlook, JPM rallied with a few of the biggest banks showing bullish price action, which probably came to a surprise to many market participants. The real test will come when the regional banks report and investors can see what’s really under the hood in the way of Held To Maturity (HTM) versus Available For Sale (AFS) securities.
More banks and brokerages are shifting AFS assets to the HTM side of their balance sheets as HTM securities are not marked to market, but this accounting maneuver, while it reflects better when earnings are released, doesn’t fix the underlying problem if there is a run on deposits. And even the Fed and Treasury creating the $2 trillion Bank Term Funding Program (BTFP) following the collapse of SVB, virtually guaranteeing 100% of deposits above $250K, has done little to bring buyers back into shares of regional bank stocks.
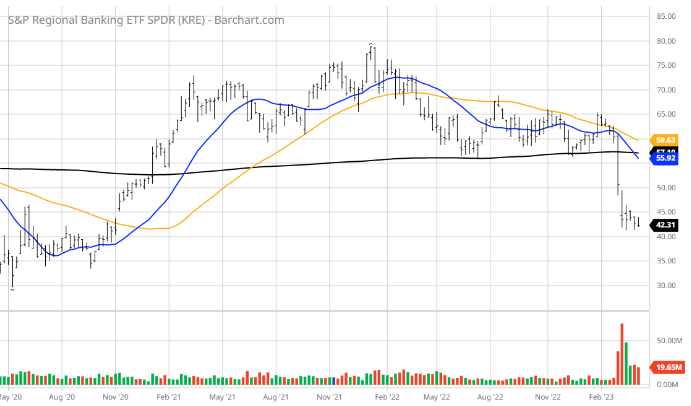
Contrary to a couple money center banks, the price action of the regional banks is downright disturbing, trading back down to levels not seen since the outbreak of Covid-19. More disturbing is that one would have thought end-of-the-quarter window dressing during the last two weeks of March would have seen most fund managers having wiped clean their exposure to this troubled sector. But heading into the third week of April, average daily volume is still brisk, as demonstrated by the below chart of the S&P Regional Banking ETF SPDR (KRE), implying little if any support, even with some Wall Street upgrades on the basis of babies getting thrown out with the bathwater.
When the paper losses per share of current stock prices are carved out and brought into the light, it is no wonder the price action is so bearish. While many factors impact the valuation of a bank stock, here is a list of some banks with their unrealized loss per share compared to their stock price as of March 12 from an article circulating in Seeking Alpha that gives some hard insight as to the extent of the problem banks are contending with, and the impending risks if bond yields start climbing again.
Citigroup (C) loss per share ($16.02) 33% of stock price
AFS $256,608 million cost – $249,679 million fair value = $5,929 million loss
HTM $268,863 million cost – $243,648 million fair value = $25,215 million loss
*Total loss $31,144 million
JPMorgan Chase (JPM)loss per share ($16.00) 12% of stock price
AFS $216,217 million cost – $205,857 million fair value = $10,360 million loss
HTM $425,372 million cost – $388,648 million fair value = $36,724 million loss
*Total loss $47,084 million
Signature Bank (SBNY) loss per share $51.44 73% of stock price
AFS $21,071 million cost – $18,594 million fair value = $2,477 million loss
HTM $7,780 million cost – $7,018 million fair value = $762 million loss
*Total loss $3,239 million
U.S. Bancorp (USB) loss per share $12.68 31% of stock price
AFS $81,450 million cost – $72,910 million fair value = $8,540 million loss
HTM $88,740 million cost – $77,874 million fair value = $10,866 million loss
*Total loss $19,406 million
First Republic Bank (FRC) loss per share $28.15 34% of stock price
AFS $3,817 million cost – $3,347 million fair value = $470 million loss
HTM $28,359 million cost – $23,587 million fair value = $4,772 million loss
*Total loss $5,242 million
Wells Fargo (WFC) loss per share $13.09 32% of stock price
AFS $121,725 million cost – $113,594 million fair value = $8,131 million loss
HTM $297,059 million cost – $255,521 million fair value = $41,538 million loss
*Total loss $49,669 million
Western Alliance Bancorp (WAL) loss per share $9.61 19% of stock price
AFS $7,973 million cost – $7,092 million fair value = $881 million loss
HTM $1,284 million cost – $1,112 million fair value =$172 million loss
*Total loss $1,053 million
Bank of America (BAC) loss per share $14.28 47% of stock price
AFS $225,485 million cost – $220,788 million fair value = $5,697 million loss
HTM $632,863 million cost – $524,267 million fair value = $108,596 million loss
*Total Loss $114,293 million
PacWest Bancorp (PACW) loss per share $8.25 67% of stock price
AFS $5,655 million cost – $4,843 million fair value = $812 million loss
HTM $2,271 million cost – $2,110 million fair value = $161 million loss
*Total loss $973 million
(Special note: $27,403 million of the HTM securities mature after 10 years. The longer the maturity, the more sensitive is the bond price to changes in interest rates. In addition, $16,808 million of that number are tax-exempt municipal bonds that mature after 10 years. Munis are also often much less liquid than UST securities.)
The data comes from the respective bank’s latest 10-K that reflect December 31, 2022, numbers, before the quarter-point rate hike on Feb. 1 and the second quarter-point rate hike on March 2 by the Federal Reserve, with another one likely coming on May 1. These are glaring numbers and are only a small sample of what’s probably out there. I can only imagine the Q&A on the earnings calls with bank CEOs in the coming weeks that will probably result in the release of a movie like Margin Call.
Thankfully, bond yields have come down recently, but they need to come down considerably more so to plug some of the gap created by the poor practice of locking in miniscule yields on long-date debt. Aside from JPMorgan Chase & Co. (JPM), investors should consider bargain hunting in other sectors. Until the price action improves (i.e., rising share prices on rising volume), further downside is a very real risk.